Implementation
Supplier scorecard template for quality and delivery
Download a blank Excel supplier scorecard template for up to 250 order lines. Track delivery, defects, costs, and response time with a worked example.
Start a supplier review

This supplier scorecard template turns physical-goods order records into four visible measures: on-time/in-full delivery, inspected-unit defect rate, landed unit-cost variance, and response time. It also shows lead-time variance as a diagnostic. Use it beside your inventory records, with missing evidence left visible rather than scored as good performance.
A supplier can look reliable when late purchase orders are split into several smaller records, or inexpensive when inspection and replacement costs never reach the comparison. The headline score needs a traceable denominator before it can support a purchasing decision.
Start with the blank Excel workbook to review up to 250 purchase-order lines. A separate example contains five fictional records with the same editable weights, thresholds, and formulas.
Its example policy is original and adjustable, not an industry benchmark or an actual supplier assessment.
Download the blank supplier scorecard for your review period, or open the worked scorecard example to trace each score back to its source rows.
Use the supplier scorecard template
The Scorecard tab shows the weighted score and its underlying measures. The Order log holds quantities, dates, inspection counts, quoted and actual unit costs, lead times, and response hours. The two-tab structure keeps the result close to the evidence without requiring a separate procurement system.
The blank file starts without order records and withholds the score until enough lines pass the input checks. Keep the worked example separate when you train a reviewer.
| Measure | Denominator | Interpretation |
|---|---|---|
| On time and in full | Complete purchase-order lines | A line passes only if both conditions pass |
| Defect rate | Inspected units | Observed defects within the inspected population |
| Cost variance | Quoted cost for received quantities | Weighted overrun relative to the quote |
| Response time | Recorded first-response hours | Mean under your agreed timing convention |
| Lead-time variance | Complete order lines | Diagnostic days above or below target |
ASQ’s supplier-quality guidance considers quality, delivery capability, total cost, and the ongoing supplier relationship. This workbook selects a narrow operating slice of that wider review. It does not replace product qualification, a factory audit, or a compliance decision.
Keep the fulfillment responsibilities visible when a discrepancy has several possible owners. A late warehouse booking should not automatically become a manufacturing failure. The score needs the agreed event and responsible party, not merely the nearest available date.
Choose one record grain and review window
Use one row per purchase order (PO) line with its original promised quantity and date. If an order arrives late in three installments, do not create three fresh on-time commitments after the fact. Retain the original commitment and document any genuine agreed revision separately.
Choose the period before selecting records. For example, review lines due in October and closed by a stated review date. List unresolved overdue lines separately rather than removing them because they lack inspection or final-cost data. This workbook scores complete closed records; it is not an open-order aging report.
A PO number alone may not be unique when the purchase contains several products. Give each line a stable reference such as PO-1042-01. A useful stock keeping unit (SKU) identifies the product, while the PO-line reference identifies the commitment being assessed.
For the review, agree the following:
- Which order lines belong in the period.
- Which promised date and receiving event determine timeliness.
- How accepted quantity and partial receipts are recorded.
- Which inspection method produced the defect count.
- Which response clock and unit-cost components apply.
Keep exclusions in the discussion packet. Removing an extreme late order without stating the reason improves the number while weakening the decision. If records cannot support a consistent review, fix the record collection before negotiating a higher score.
Define each measure before assigning weights
On-time/in-full, or OTIF, is binary here. A line receives one only when received quantity meets or exceeds ordered quantity and its recorded receiving date is no later than the committed date. Otherwise, it receives zero. All complete lines carry equal weight for this measure.
Defect rate uses total defective units divided by total inspected units. It pools the counts, rather than averaging row percentages. One defect in ten inspected units and one in a hundred should not contribute equally just because each occupies one row.
Cost variance uses the received quantity for each line. It adds actual-minus-quoted unit cost multiplied by received units, then divides by the quoted cost for those same units. That compares the same received population on both sides of the fraction.
Response time is the mean of the entered first-response hours. Decide whether you measure calendar hours or staffed business hours, and what counts as a meaningful response. An automatic acknowledgment should not become a fast resolution merely because it has a timestamp.
Lead-time variance is actual lead days minus target lead days, averaged over complete lines. It is diagnostic only and receives no additional weight. Otherwise, the same delay could count through both OTIF and another weighted timing metric without a deliberate policy choice.
The broader distinction between performance evidence and supplier selection matters. ASQ describes using quotations, assessments, references, and sample evaluation as well as ongoing evidence. A supplier-quality review needs more than this workbook’s four operating measures.
Read the fictional five-order example
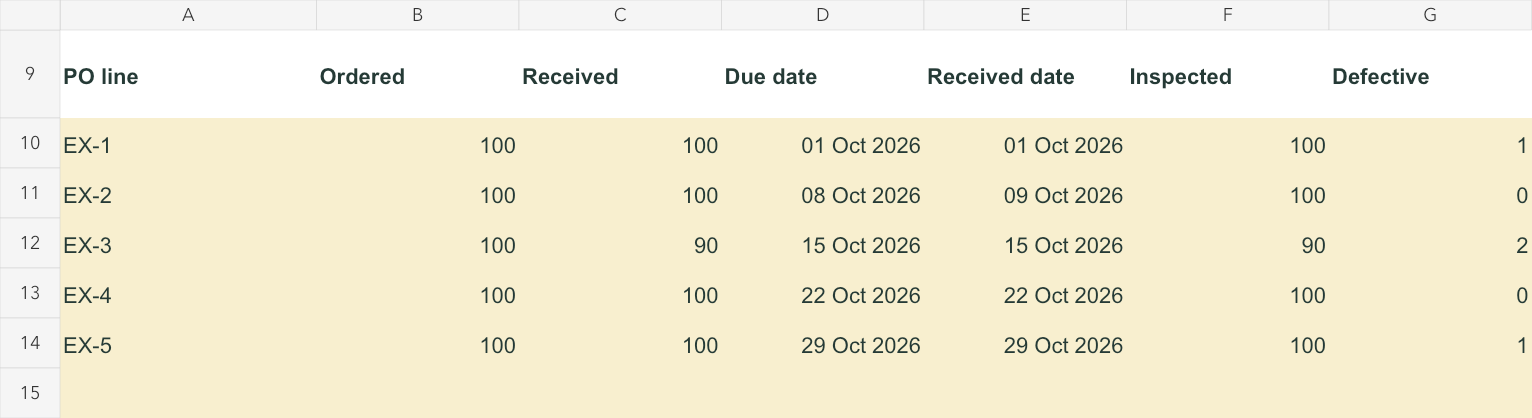
The example contains five order lines of 100 units each. One arrives late and another delivers only 90 units by the promised date. Three lines meet both delivery conditions, so OTIF is 3 divided by 5, or 60%.
The receiving records contain 490 inspected units and four observed defects. The pooled defect rate is about 0.816%. Quoted cost for the received population is $980; the weighted overrun is $16.50, giving approximately 1.684% cost variance.
First-response times are 4, 6, 30, 2, and 8 hours. Their mean is 10 hours. The example also has one additional lead-time day across five lines, so the average lead-time variance is 0.2 days.
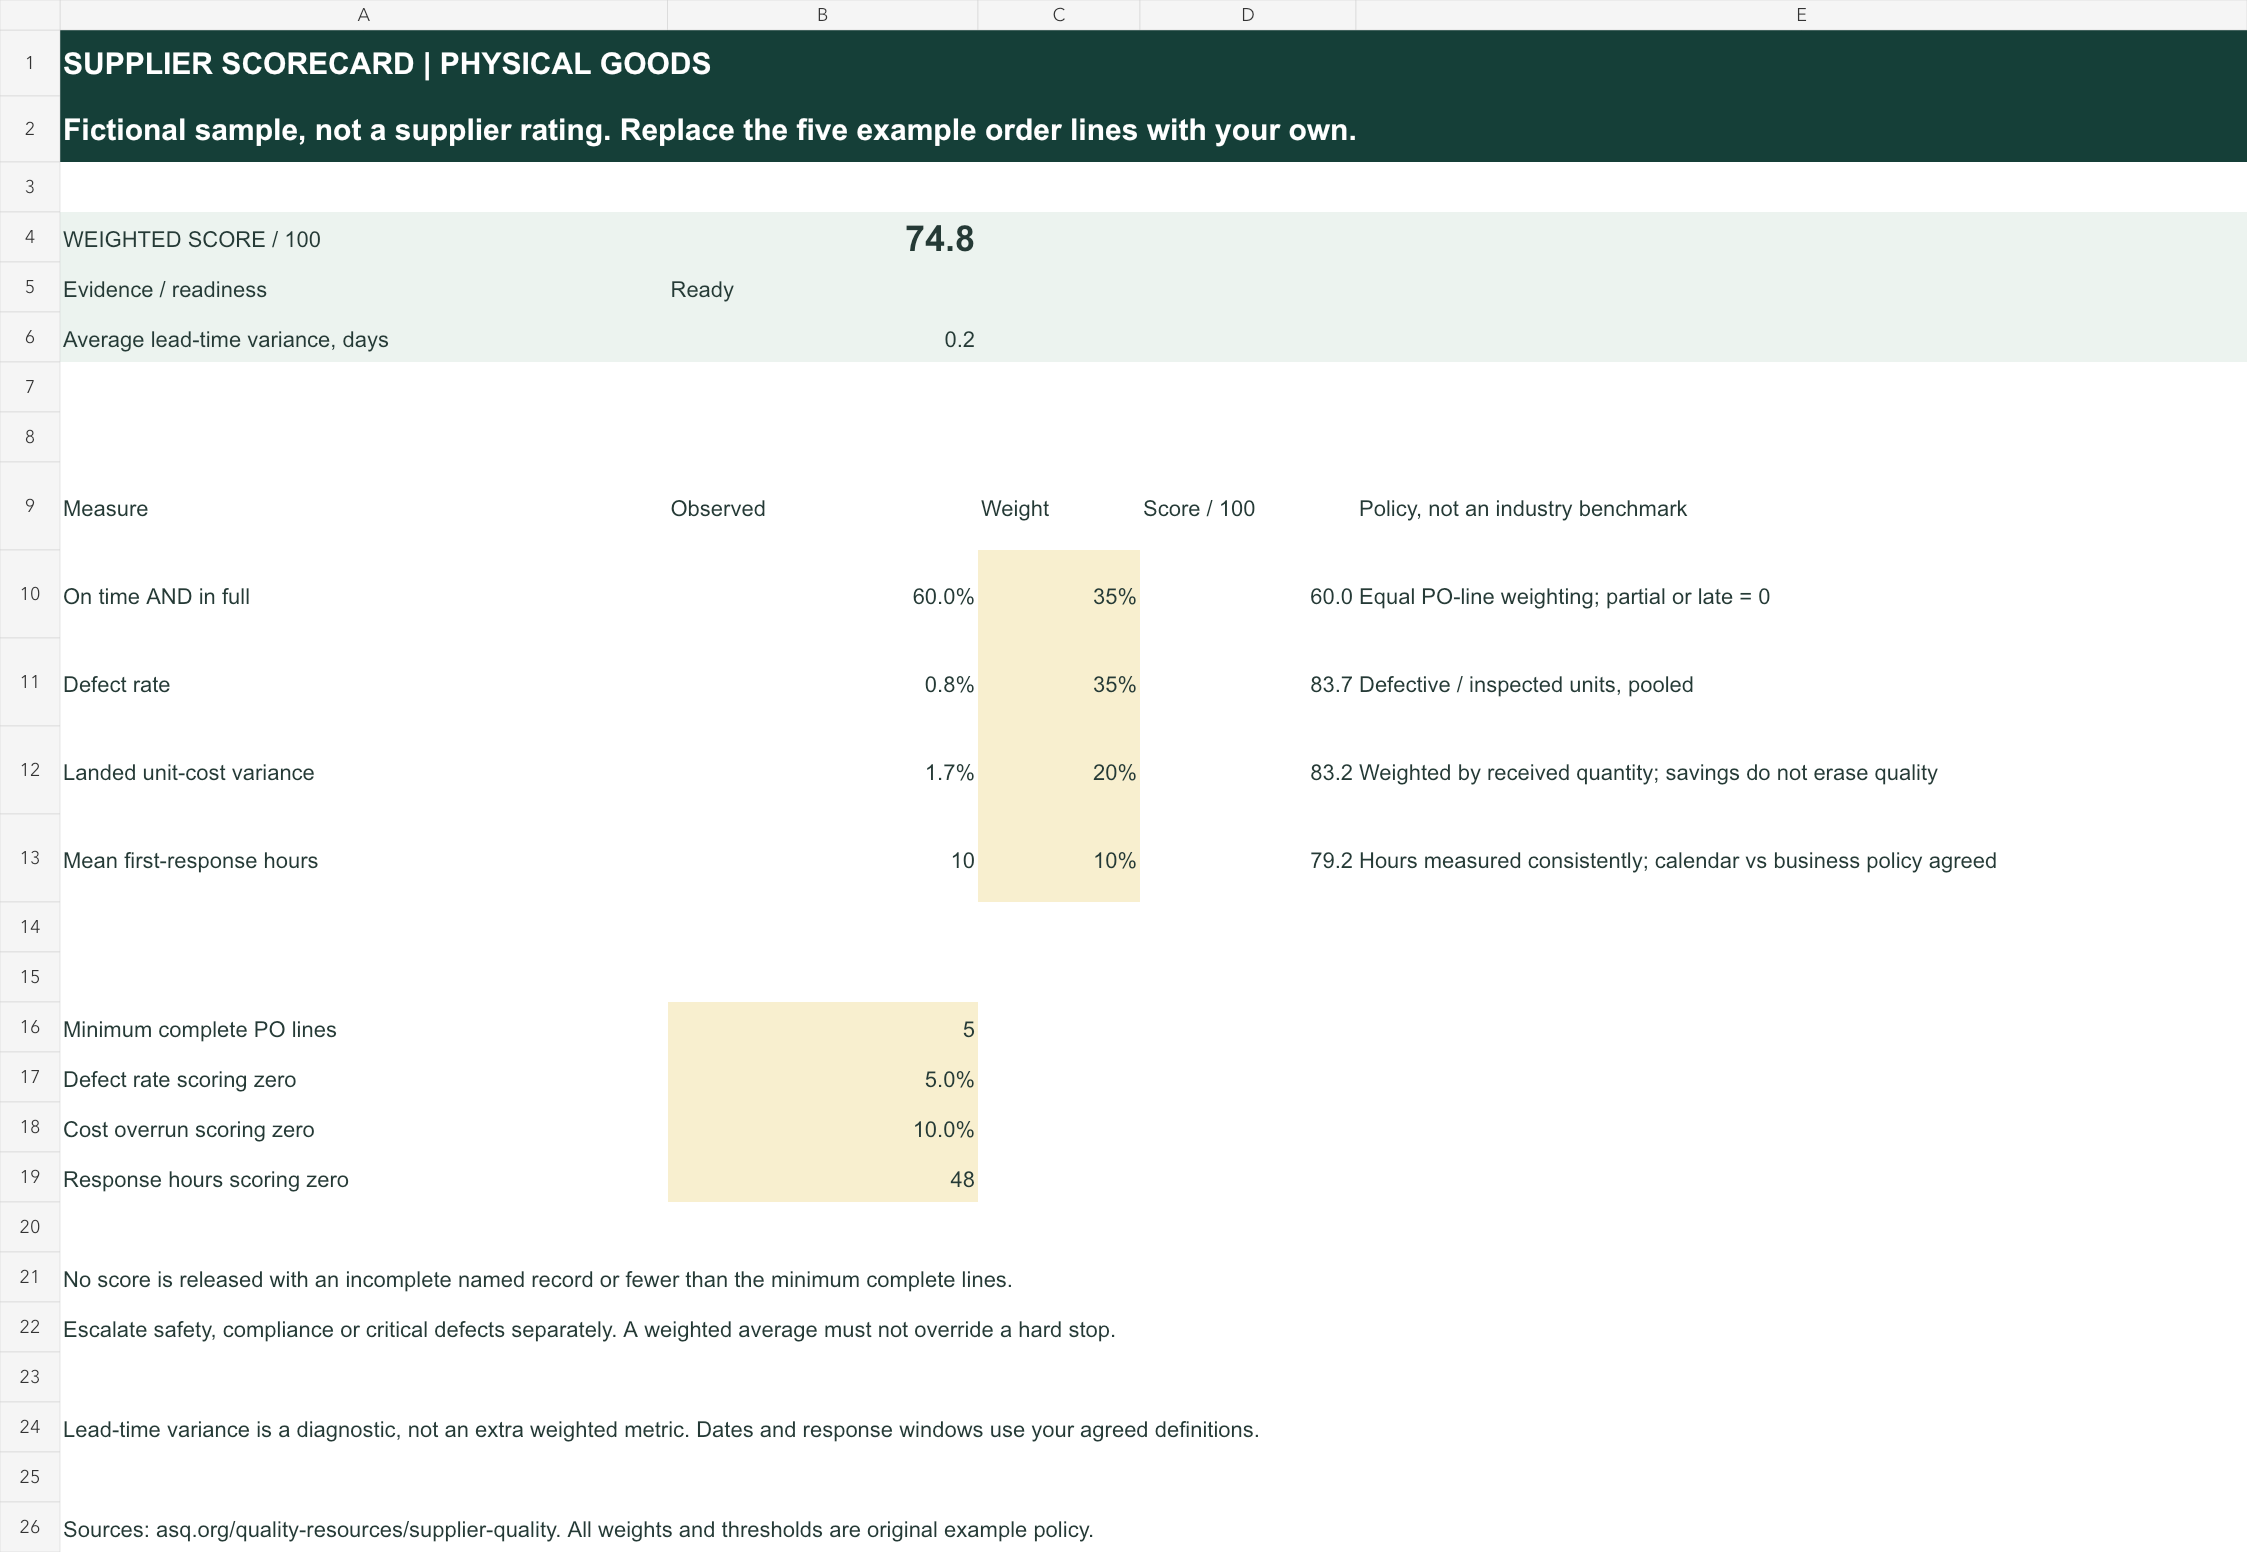
The default scoring policy produces approximately 74.8 out of 100. That number is a calculation from fictional records and the chosen weights, not evidence that a real supplier deserves approval or rejection. Change the policy only after deciding what the score should help the buyer do.
Use the landed-cost worksheet if quoted and actual costs are still inconsistent. A supplier cost-variance measure cannot be trusted when one column includes freight and the other only contains factory price.
Set a scoring policy your supplier can inspect
The default weights are 35% delivery, 35% quality, 20% cost, and 10% response. They sum to 100%. The workbook withholds its overall score when the weights do not add correctly, rather than silently rescaling an accidental change.
The example translates the measures to a common scale as follows:
| Measure | Example scoring rule | Default policy input |
|---|---|---|
| OTIF | Observed proportion × 100 | No extra threshold |
| Defects | Linear decline to zero at the chosen defect rate | 5% defect rate scores zero |
| Cost | Linear decline to zero at the chosen positive overrun | 10% overrun scores zero |
| Response | Linear decline to zero at the chosen number of hours | 48 hours scores zero |
These are demonstration policy settings. A safety-sensitive product may require a very different quality rule, and a custom product may justify a different response window. Do not label the defaults “industry standard.” They have not been established as such.
Cost savings cannot lift that metric above 100 in this model. A cheaper delivery therefore cannot create unlimited points to offset a quality failure. The weighted average still needs a separate hard-stop policy, discussed below.
ASQ’s short supplier-scorecard overview describes scorecards as a way to establish targets and measure progress. Agree definitions and improvement targets before the period begins. Changing thresholds after seeing the supplier’s result turns a measurement policy into a negotiation tactic.
For your first use, duplicate the scorecard workbook, change one weight, and verify that an invalid total is flagged. Restore a valid weighting before entering real supplier records. Keep the approved policy version with the review period so future scores remain comparable.
Keep missing data and small samples visible
The workbook requires complete numeric inputs for every named order line. A missing response time or inspection count prevents the overall score from appearing. A real zero remains a usable value where the measure permits it; a blank does not become zero merely because that would produce a cleaner dashboard.
The example minimum is five complete lines. That is a demonstration gate, not a statistical claim that five observations establish reliability. A supplier with five easy orders should not be compared casually with one handling hundreds of varied products and deadlines.
Check the record status beside the raw inputs. Invalid quantities, duplicate PO-line references, or defective counts greater than inspected counts require correction. Deleting the line to clear the warning would also remove evidence, so resolve the discrepancy with its owner.
The log scores rows 10 through 259, or 250 purchase-order lines per review. Keep the records within that range. If you receive 90 of 100 units and leave the inspection count blank, the workbook withholds the score. Enter the observed count from your receiving record. Once the line is complete, the short shipment scores zero for on-time/in-full delivery.
The score also cannot answer how representative the inspected units were. Sampling ten visible units from one carton and inspecting a random sample across a shipment are different evidence sets. Record the inspection policy and do not describe the observed defect rate as a guaranteed rate for every uninspected item.
Separate critical incidents from routine scores
A weighted average should not authorize a product that fails a critical safety, compliance, or agreed specification requirement. Record those incidents separately with the affected SKU, lots, quantities, containment decision, and responsible person. A high delivery score does not clear an unsafe item.
The template therefore presents evidence for discussion, not an automatic “approved supplier” status.
Your purchasing, quality, and compliance owners need to define which incidents stop receiving or ordering regardless of the calculated score.
A published NIST fictional training case study illustrates supplier evaluation using quality, delivery, and service within a broader management system. It does not validate this workbook’s thresholds or prove that a particular weighting suits your business.
Connect repeated failures to their actual operating cost. Late receipts can affect a reorder plan, and defects can raise the saleable-unit cost. Use those records to explain the consequence without inflating the scorecard into a universal measure of supplier quality.
Send the supplier a specific corrective request
Share the underlying records and definitions with the supplier, not only a score. Identify the commitments missed, the inspected population, the defect descriptions, and the cost basis. Invite corrections to factual errors while preserving the originally agreed dates and policy.
Turn the review into a bounded request:
- Identify the affected PO lines and product references.
- State the observed issue and the evidence supporting it.
- Agree immediate containment where necessary.
- Request a cause analysis and a named corrective action.
- Set a review date and specify what evidence would show improvement.
For a later comparison, keep the same record grain and scoring policy or explicitly explain the change.
A rising score is difficult to interpret if the inspection sample, response clock, and order mix all changed at once.
Open the supplier scorecard template, enter your review-period rows, and agree the definitions with the people who own receiving, quality, and purchasing.
Use the resulting evidence to request one specific improvement, while handling critical incidents through their own decision process.